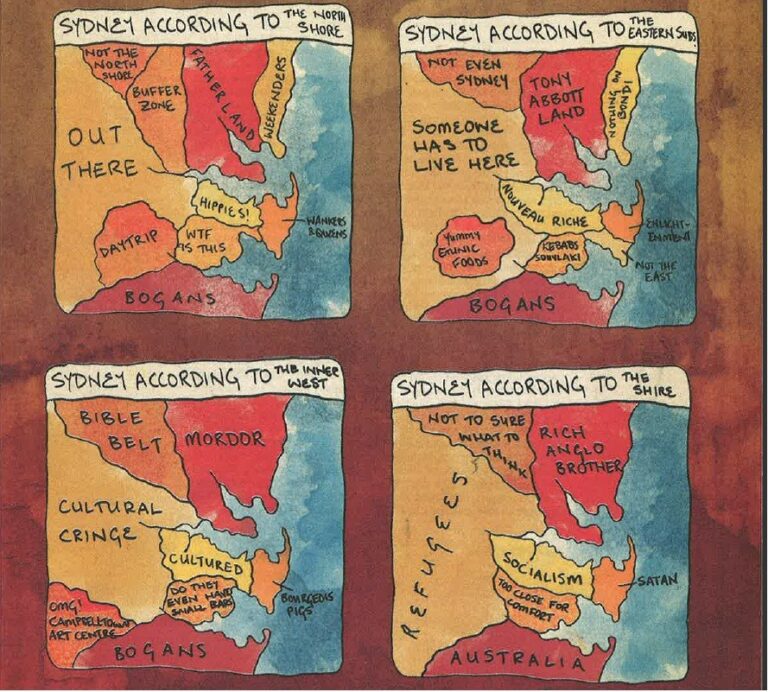
Tharunka (UNSW’s student newspaper, meaning “message stick”) localised it for Sydney in a style paying tribute to the original, and which pops up regularly in memes and social media, as displayed in our headline image.
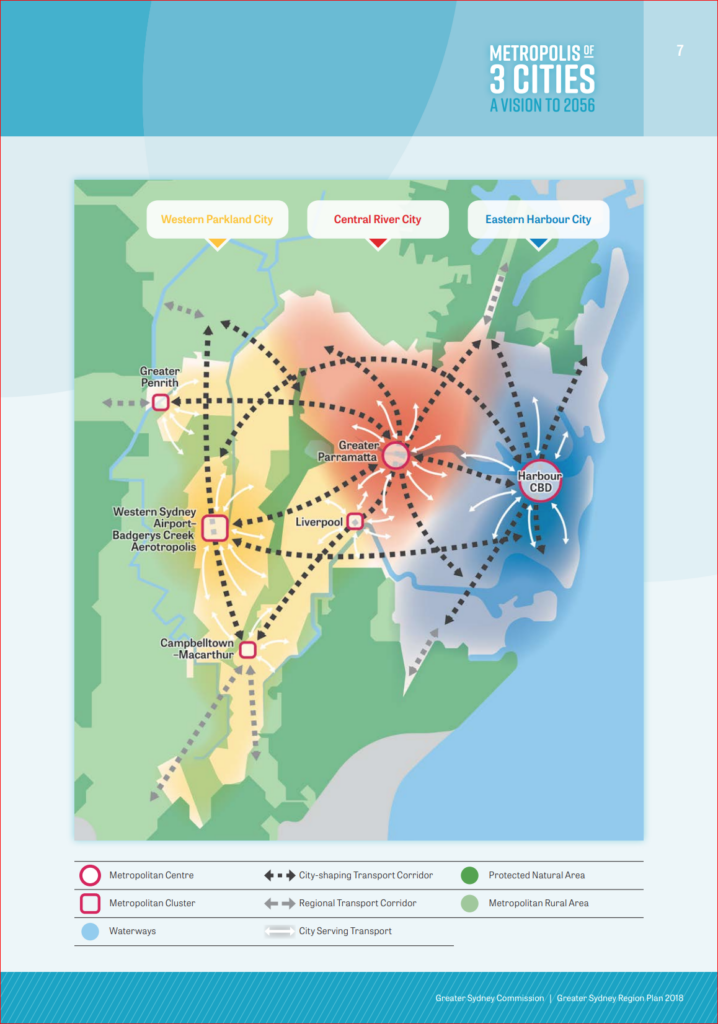
The concept has been expanded by the evolution of Sydney’s “latte line”, also known as “the Red Rooster line”. Some have added the “El Jannah line”, breaking the city into three sections. Others have expanded into other food groups, with similar outcomes. Coincidentally, the Greater Cities Commission has somewhat more formally characterised Sydney into three cities, namely the “Western Parkland”/”Central River”/”Eastern Harbour” Cities (refer map below).
So clearly, we have tribes. But there’s a problem, and Tharunka’s version highlights it, perhaps unintentionally. A charitable view would be they were limited to four panels. More likely they fell into the same trap. The four perspectives offered all come from the “Eastern Harbour City”. Which, intentionally or not, misses more than half of Sydney’s population. We know because, ironically, the advertising industry itself knows more than 50% of Sydney’s population lives more than 20km from the CBD. Or, more colloquially, west of the “latte line”.
Why the aforementioned irony? Simple – Sydney’s ad industry is highly concentrated in the east. Anecdotally, this is a problem. Why? An example (which has happened all too often). We’ll pitch to an agency and the discussion goes something like this:
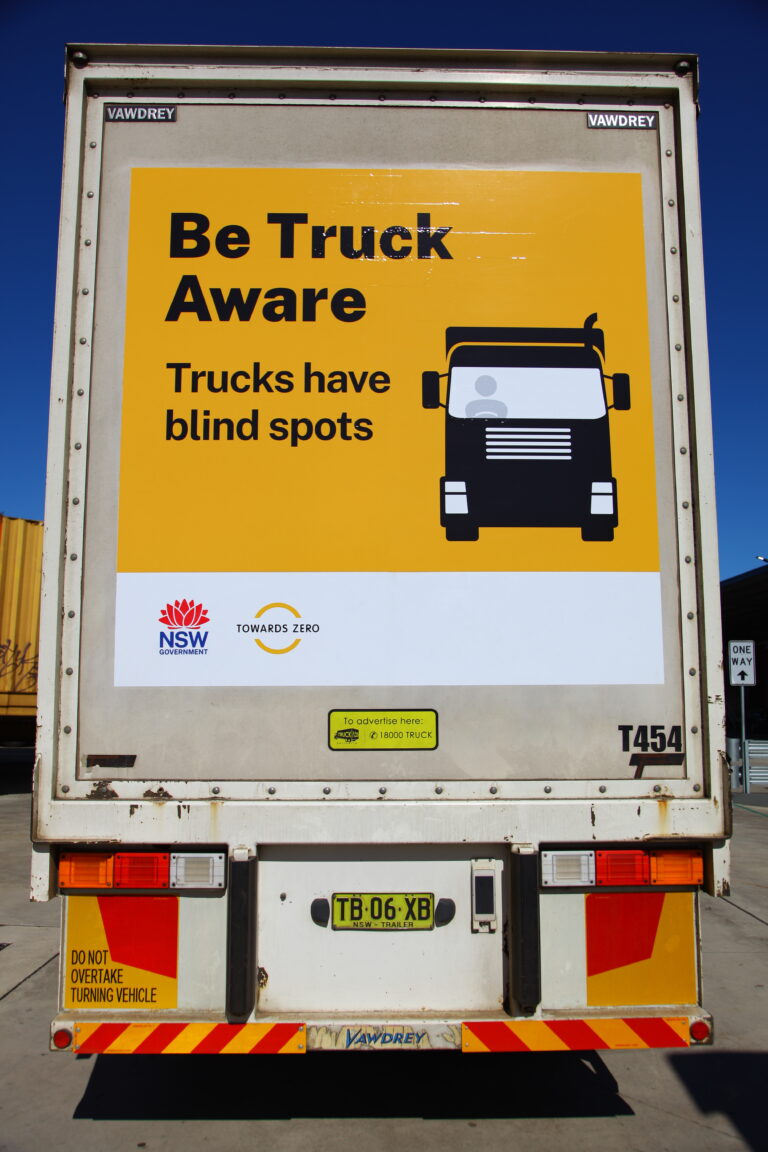
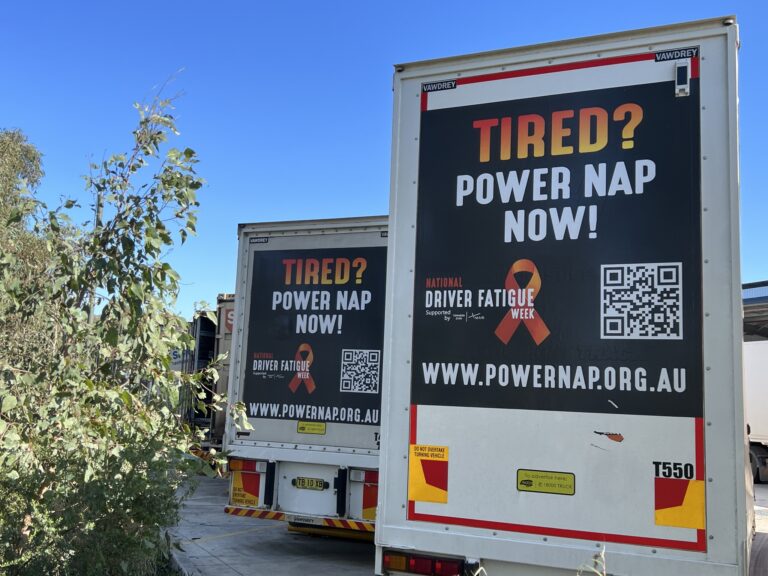
Agency: “But I never see any trucks” (they do, but that’s another story).
Our response: “Where do you live?”.
Agency: “Bronte”.
Us: “Where’s your office?”.
Agency: “Surry Hills”.
Us: “How often do you go to the office?”.
Agency: “Once or twice a week”.
The Bronte to Surry Hills corridor is ~30km2. Greater Sydney is ~12,500km2. So the home/work corridor, where most time is spent, represents exposure to only ~0.25% of greater Sydney. Little wonder they don’t think they see trucks and, whether consciously or subconsciously, this skews the decision making. This is a regular theme of Bob Hoffman’s and one supported by data from Kantar, showing a disconnect between marketers and the general population.
Ashleigh Markou highlighted it more recently in this excellent article via Adnews, and Brian Gallagher and the Boomtown team have been advocating similarly for regional Australia. For example, 3 of the top 5 online shopping postcodes are in regional Australia. Guess how those items are delivered (hint: if you’ve got it, a truck brought it)? By their raison d’etre, trucks follow people. It’s that simple.
The challenge, therefore, is twofold: firstly, by recognising the bias and thus the need to change the decision making process, and secondly, crafting a solution to reach the various tribes, often in areas where media options are limited and behaviours are different.
Which leads to the next question – what are you doing to better understand the wider collection of tribes in 2024? How are you going to break out and see the unseen? Pick a suburb you’ve never heard of, or been to, and go explore it? Who knows what you may find there or along the way?
What about other capitals and regional cities in Australia? Do you have a “latte line” or something similar?
As Marcel Proust once said, “The real voyage of discovery consists not in seeking new lands but seeing with new eyes”.